Reports
1. Once you start promoting your campaign, you need to activate it in Reports.
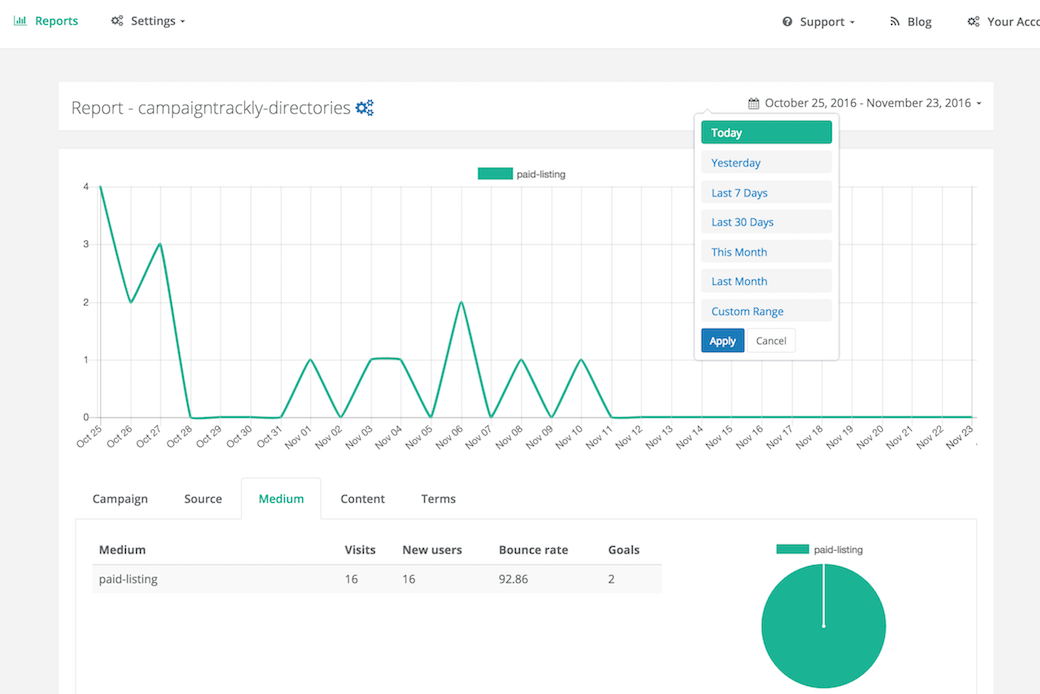
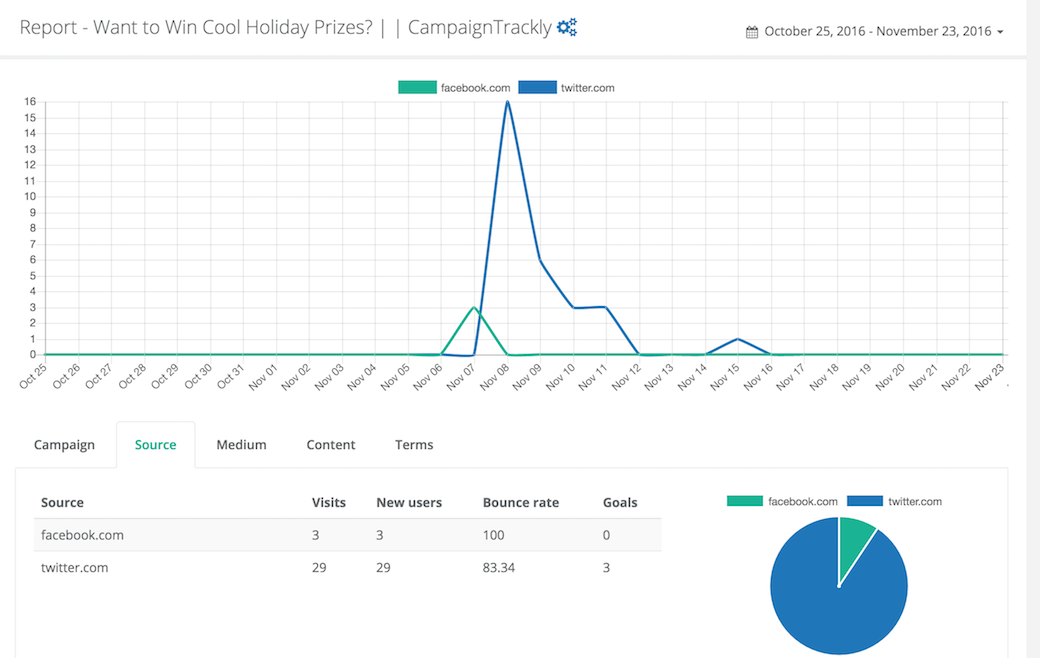
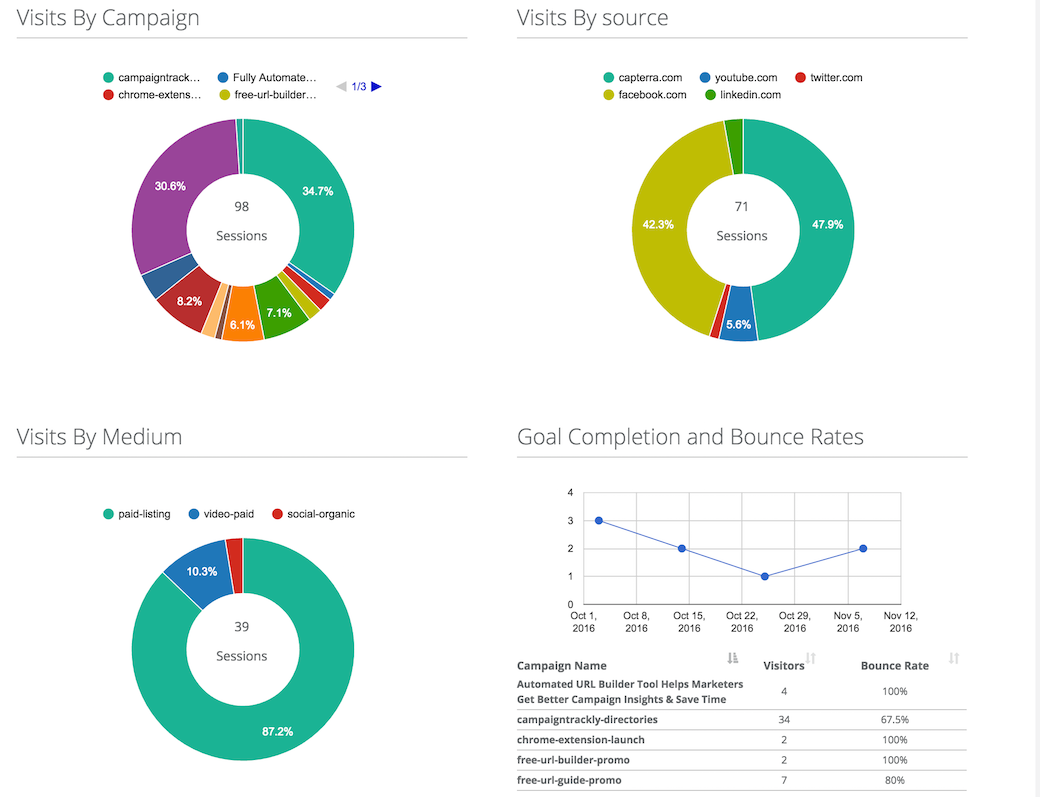
- In Reports, you have a dashboard page that gives you a snapshot of your activated campaigns in the last 60 days. In it, you can see campaign performance by name, source, medium, goals, as well as every campaign’s bounce rates.
- For convenience, we have easy pagination & sort options – very similar to what we have in Campaigns.
- To get your dashboard started, please make sure you are tracking each campaign – see p. 2.
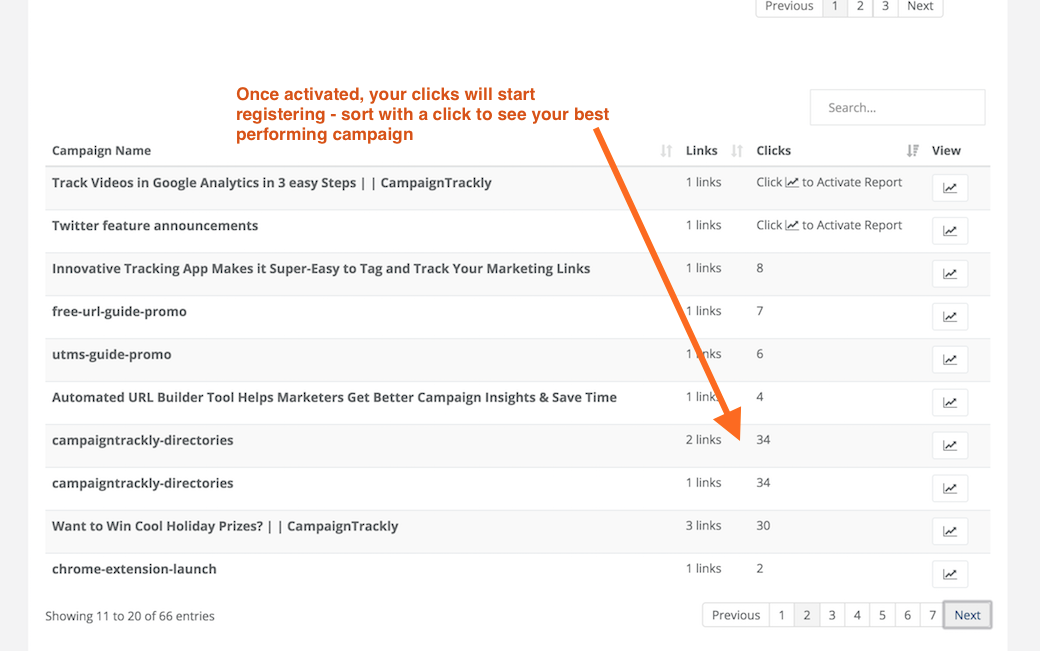
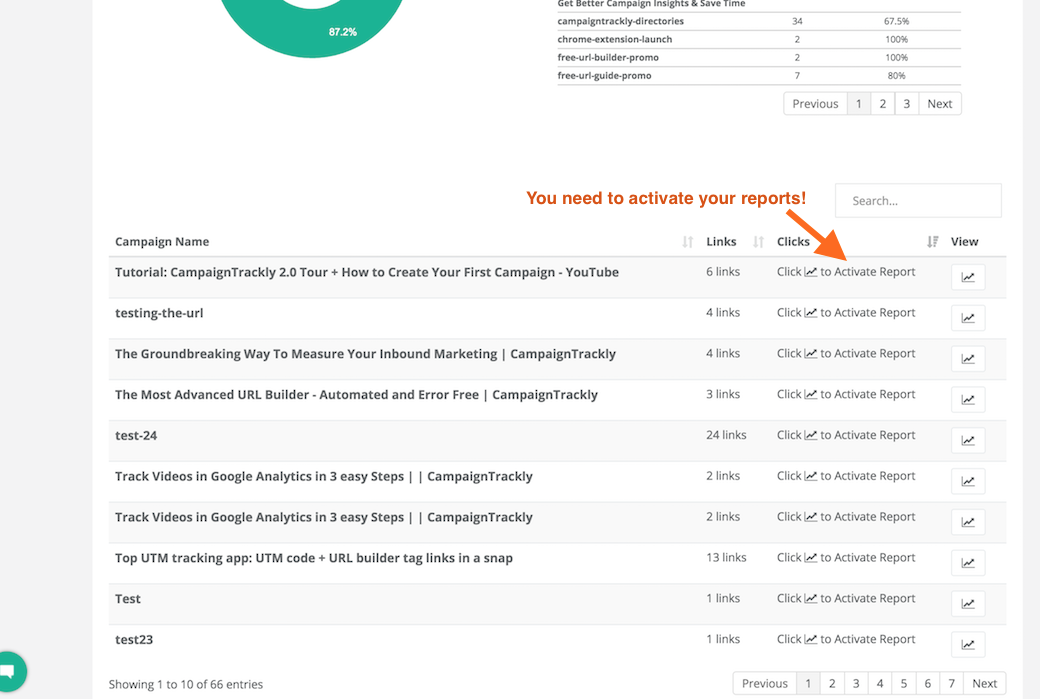
2. To activate your campaign, scroll down to the Campaign list section of Reports.
- As soon as you create a campaign – it will be listed in Reports
- You have to activate it to get the data & insights
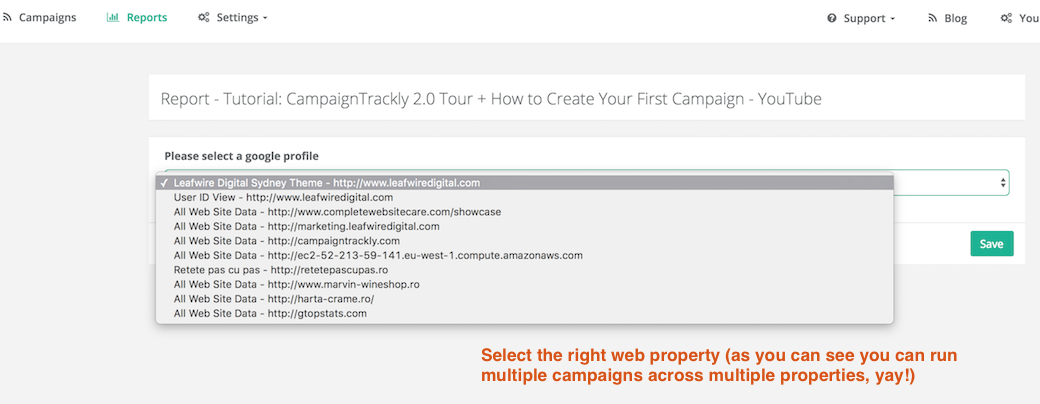
3. Once you Click to Activate Report, you need to confirm the Google Analytics account you are using for this particular campaign
- You might be managing multiple accounts or properties – if you are a larger business or an agency
- Note – if you don’t see anything on this page, this means that you are not connected or logged into your Google Analytics. Please check your connection in Settings or contact us asap.
4. Once you activate the report, you see an EMPTY table, don’t get disappointed!!!:))
- It takes a bit of time for the data to pass into CampaignTrackly
- If for some reason you are promoting your campaigns, but you are not seeing any data here, please contact us for troubleshooting and help.
- If you other campaigns are raking clicks and goals, but this one is still staying at zero, check to make sure that:
- you have set up the right web property;
- this might mean there is something wrong with your campaign – your link, landing page, or you might need to optimzie it.
![]()
5. This is how your campaign list will look like if you have NOT activated your campaigns:
6. Once you start adding more campaigns, your campaign list should look like this:
</h4″>